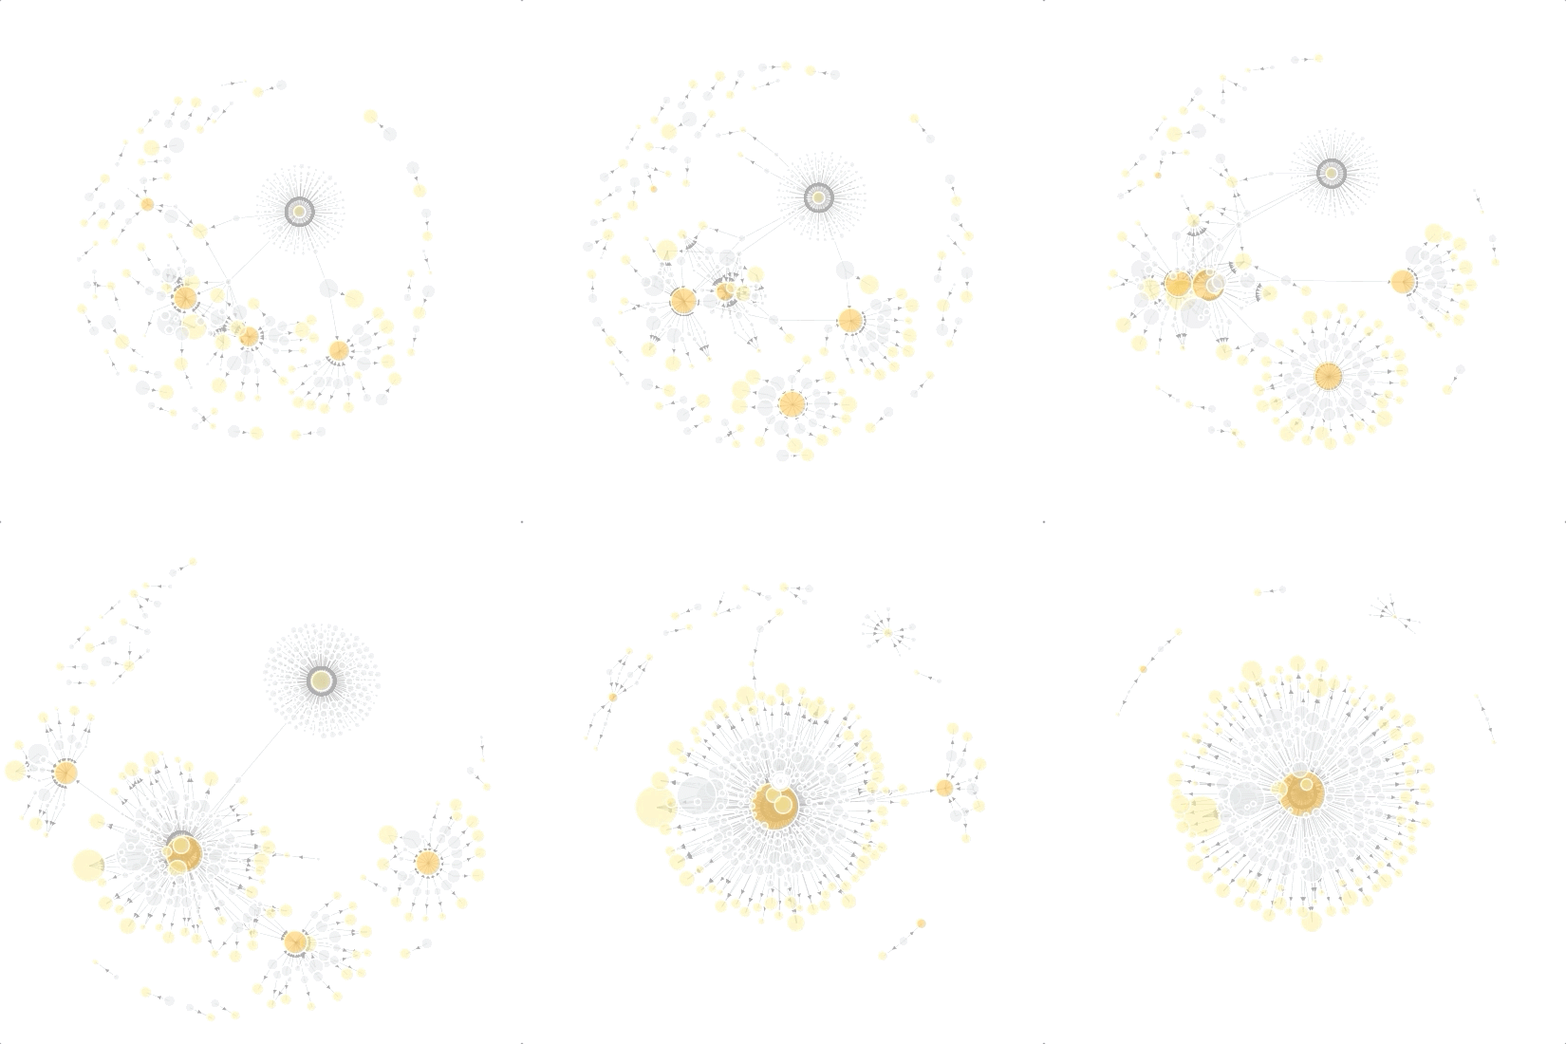
Decentralized Portfolio
Some work has been done in the connected section in the middle-right, but otherwise sites and their data are disconnected.

Centralized Portfolio
A ring of sites (in grey) send data in two directions: all sites send into a centralized analytics property (in yellow), and each site sends to its own singular property (the outer yellow ring).

Animated, self-organizing graphs
Graphs are animated and self-organizing. Sites cluster based on natural properties like gravity - those that are linked stay close, and those that aren’t linked drift away from each other.

Dual-brand GTM data flow
For this dual-brand view, site nodes have been color-coded to visually identify brands - one is blue, the other is orange. This data flow is symmetrically organized, with one Google Analytics property per brand. Some data flows from brand-specific GTM nodes (purple, left and right) and some flows from a cross-brand node (purple, center).

Hidden connections
(without data access)
Using only scraped data, Intarsia reveals an underlying data structure - and media coordination - among these ~700 dealer websites. Each cluster represents dealers in a single country. The countries’ different approaches to organization are clearly visible.

Data leakage
These sites (in grey) do use owned, centralized GA & GTM (yellow and purple, center). But in addition, each site appears to load several pink-outlined GA properties and GTM containers - creating a plethora of opportunities for security and compliance problems.
Show Progress
Over time, improvements to a fragmented portfolio lead to more centralization. These improvements are made visible and tangible in Intarsia’s graphs.

